
Jordan's 1.08% Gem Rate and Trout's 42%: What This Week's Population Data Actually Tells You
Four blue-chip cards, eight data points, and one number worth watching as the LeBron PSA 7 pool grows without a matching climb at the top grade.
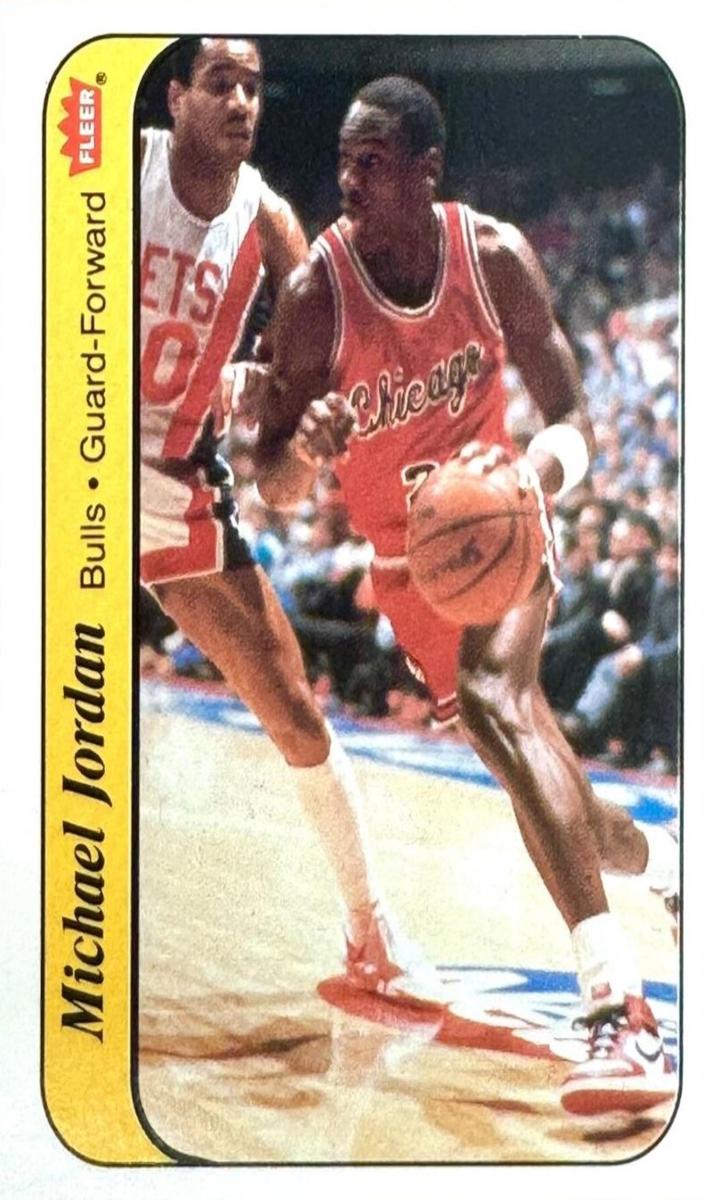
The gap between a 1.08% gem rate and a 42% gem rate is not just a vintage-versus-modern curiosity: it changes the math on every submission decision and every mid-grade purchase. The LeBron PSA 7 population climbing while the gem rate ticks down is the one number in this week's data that could mean something real if it holds.
- The 1986 Fleer Michael Jordan gem rate slipped from 1.09% to 1.08% this week; PSA 8 population rose from 9,413 to 9,423.
- The 1989 Upper Deck Ken Griffey Jr. gem rate moved from 3.20% to 3.19%; PSA 9 population climbed from 34,748 to 34,765.
- The 2003 Topps LeBron James gem rate fell from 11.70% to 11.68% while the PSA 7 population grew from 2,110 to 2,119, more copies grading, proportionally fewer reaching the top.
- The 2011 Topps Update Mike Trout gem rate dipped from 42.13% to 42.10%; PSA 10 population added two copies, moving from 7,100 to 7,102.
- A 42% gem rate on the Trout is a real ceiling to model against before submitting a raw copy.
- This is week one of a young tracking series, 47 of 763 series we follow have been read more than once, so these figures are a baseline, not a trend.
- Nothing in this week's data demands action; return to this barometer in four to six weeks when week-over-week deltas start to say something.
The 1986 Fleer Michael Jordan has a 1.08% gem rate. That means for roughly every 10,000 submissions, 108 come back a PSA 10. The 2011 Topps Update Mike Trout sits at 42.10%. Both numbers moved this week, both by two hundredths of a point. The gap between them is the entire distance between vintage cardboard and a modern print run, and it shows up in a single column of data.
The Jordan and Griffey: Slow Grind, Same Story
The Jordan's PSA 8 population added ten copies over the week, moving from 9,413 to 9,423. The gem rate slipped one hundredth of a point to 1.08%. The Griffey's PSA 9 population added seventeen, going from 34,748 to 34,765, with the gem rate dropping from 3.20% to 3.19%. Single-digit and low-double-digit weekly adds against populations in the thousands and tens of thousands mean supply is moving, just slowly. The market has priced this in: gems on both cards are rare, and the ungraded pool that could produce new ones is shrinking with every submission cycle. Neither number this week changes that read.
The LeBron Number Worth Watching
The 2003 Topps LeBron James is the card to watch as this series matures. The PSA 7 population climbed from 2,110 to 2,119 this week while the gem rate simultaneously ticked down from 11.70% to 11.68%. More copies entering the graded pool without a proportional increase at the top grade suggests the remaining raw supply skews toward lower-condition copies. If that pattern holds over future weeks, it compresses the value of mid-grade LeBrons relative to gem copies rather than lifting all grades together. One week is an observation, not a trend — but it is the right observation to track.
More copies grading, gem rate declining: if that holds on the LeBron, mid-grade copies get relatively cheaper while gems get relatively scarcer.
The Trout's 42% and What It Means for Submission Math
Two PSA 10 Trouts were added this week, bringing the population from 7,100 to 7,102. The gem rate sits at 42.10%. That figure is high by any comparison on this watchlist, but it is also a ceiling, not a floor. If you are holding a raw 2011 Topps Update Trout and considering submission, 42% is the honest probability to model against: and that number could compress further as condition-sensitive copies that have been sitting in collections enter the pipeline. Whether those two new PSA 10s represent a single submission batch or broader market activity matters for interpreting momentum, and the population data alone does not answer it.
How to Use This Barometer
This is the first reading in a young series. Of the 763 card series tracked in this barometer, only 47 have been read more than once, so these numbers are a baseline rather than a pattern. The value of a fixed watchlist is that the same cards are compared to themselves week over week: the Jordan is always the Jordan, the Griffey is always the Griffey. Come back in four to six weeks. That is when the week-over-week deltas on the LeBron PSA 7 population and the Trout gem rate will start to say something definitive about where those cards are heading.
If the LeBron PSA 7 population keeps growing while the gem rate keeps declining, at what point does that shift the market's pricing of mid-grade copies relative to PSA 10s?